Perseverance

Sooner or later, the serious athlete reaches a career checkpoint to stare face-to-face with an ominous fate that suggests that maybe your time is up. Self-doubt whispers that your best days have long been archived. Free yourself from the pain of the disappointing performances and the anguished losses. Stop chasing dreams in the gym and start enjoying ice cream and Netflix again.

It is rare for the athlete to slam the door on that fate, get back onto the road with the rugged terrain, and demand even more from the skills and heart that remain. Because that would require extraordinary mental strength to believe in something that seems to have all but evaporated.

It was a year ago that Marissa Cappello, college pitcher for Stevens Institute of Technology, faced that tough choice at the end of h
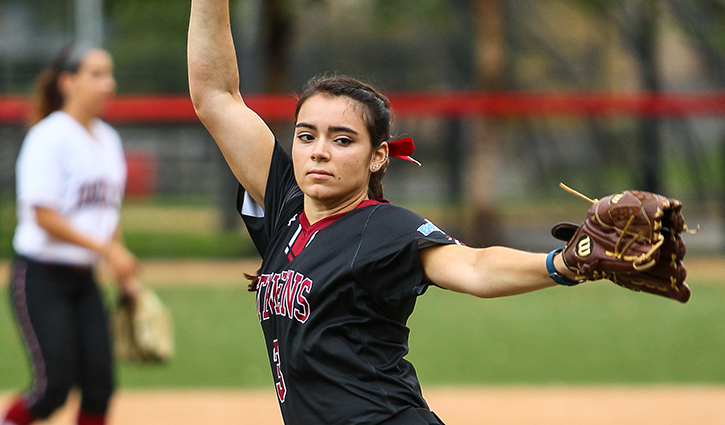
er sophomore season. She was fresh off a heartbreaking loss, on a field she no longer felt worthy of performing.

Thanks to the decision she made that day, Marissa elected to go back to the drawing board, and through sheer will overcame whatever challenge came in her path over the following 12 months to become a dominant force on the mound again, earning co-MVP of her team and All-Conference and All-Regional honors for the 2018 NCAA Division III college softball season.

Marissa finished with an 11-3 W-L record and four shutouts while blowing away her school record for strikeout rate at 8.53 K’s per seven innings. Her ERA (1.64), batting average against (.180), slugging average against (.239), winning percentage (78.6%), and strikeout rate, key statistics for quantifying pitching dominance, all ranked second in the conference only to St. John Fisher’s Lindsey Thayer, who this season capped off a legendary four-year career by breaking the all-time NCAA Division III record for most strikeouts.

Marissa’s season did not even seem feasible 12 months ago, at the site of a tough playoff loss that left her confidence shattered. Her eyes that day told the story. She was broken. She thought very hard about the prospect of quitting. It would end the pain. No more striving for…for what? More disappointment and embarrassment? More than anything Marissa wanted her teammates to be able to trust her, and she felt she had lost that. She battled all year to try and find that piece of greatness she once showed in the circle, only to keep butting up against the wall of erratic mechanics and inconsistency.

Quitting would have been easy. And it’s not like majoring in Chemical Engineering couldn’t use the extra cycles of her attention. As a parent, I was conflicted between knowing that she still had the skills inside her and the emotions of wanting my daughter happy and free of the pressure and the torment. Let’s go get some Ben & Jerry’s, watch some Brooklyn 99, and everything will be well.

My wife and I left all doors open for her to decide. Whatever your choice, your mom and I will be behind you 100%. She looked at me with eyes still clouded of tears and the pain of failure and somehow, abruptly, showed a sense of conviction. “I am not done,” she said. “I’m going to start from scratch and do this right. I am not ending my career here.”

And so starting last June, Marissa started a complete rebuild of her mechanics. She bought in to a method of teaching that has made its way into Division I colleges and Olympic programs nationwide. She committed faithfully to its philosophy, for she knew she would have to live by it for her last two seasons of her softball career, assuming all goes as planned. There was no going back; no more time to unlearn and relearn. She knew she had one more shot. She was all in.

For six weeks into the summer, Marissa didn’t throw one full pitch. She was training a new arm swing and delivery, trying to hardwire new linkage between her brain and muscles, overwriting the old firmware with a high-performance version that could be called upon repeatedly. So those first sessions were all about drilling on the pieces that make up the whole, like learning basic piano notes before jumping right into Moonlight Sonata.

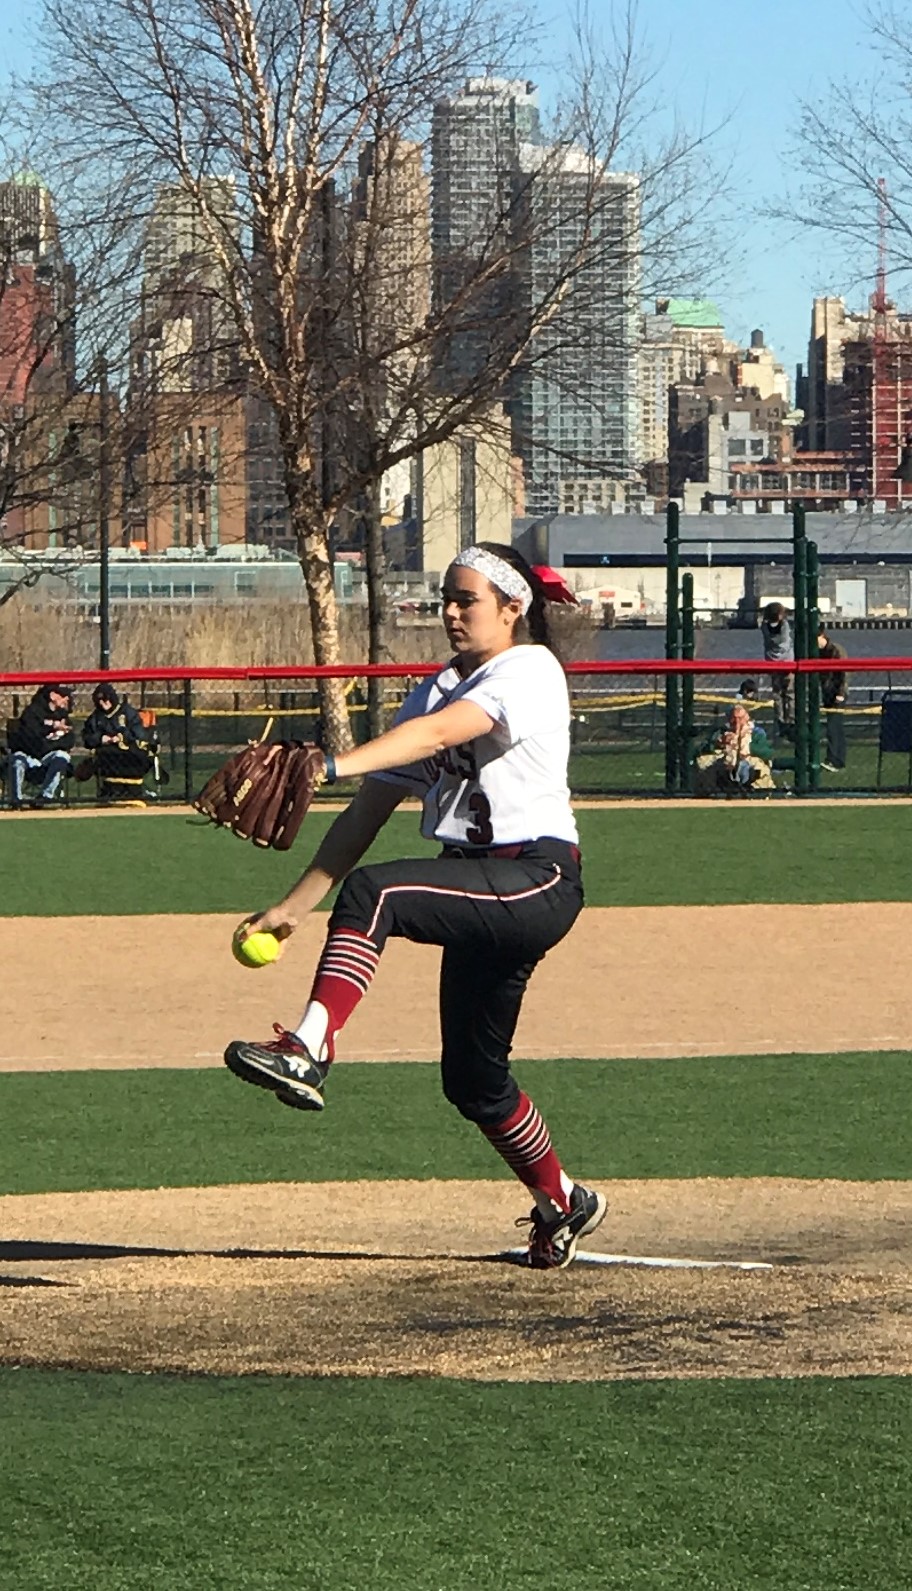
By the time her school’s fall season came around, she had barely got into any spin pitches, let alone throw complete innings. That was okay because the fall season is more of a toes-in-the-water mentality. Focused on the big picture, Marissa simply wanted to let her teammates and coaches know that she was back in the saddle and on a good trajectory. She made a brief appearance, but it was effective. No one else really noticed, but it was a mental check box she was able to mark off, and it gave her the confidence that her path was true.

January arrived, and her team was gearing up their winter training and preparations for a spring season that was just weeks away. Marissa was ready to continue her quest, but it quickly became apparent that she had more hurdles to jump then what she bargained for.

A new pitching coach joined the team’s new head coach, and together they formulated a plan for getting the pitchers and hitters to adopt the mechanics they believed would maximize their talents. It was a reasonable ambition for the new season. They don’t hire college coaches to mow the outfield grass.

Unfortunately, they looked at Marissa’s new motion and did not recognize it as something to build on or improve upon. They wanted to change it, like, immediately. Marissa was very uneasy about the prospect of unlearning everything she had been drilling since last June. She was on a mission, after all. She held strong…but so did the coaches. They told her if she didn’t comply with their recommended changes to her mechanics, they could not help her and may not be able to depend on her as a starter for the team.

The season started worse. On the team’s spring trip to Arizona, Marissa hadn’t even pitched two full innings before a fever gripped her for two weeks. Her absence did not do her any favors. When she became healthy, the team informed her that they were going with two other pitchers as their starters. Marissa was out.

This was devastating. As the weeks of the new season went on, Marissa was feeling stronger and more confident in her changes. She still believed in what she was doing. But if her coaches weren’t buying in, it wasn’t going to matter. She was well into her junior season and she was quickly running out of options. Marissa asked the coach for one more shot at the starting role.

On March 31, the twelfth game of the season, she got it.

Pitching the second game of the season’s first conference doubleheader, Marissa didn’t waste any time presenting her case. She struck out the first batter she faced. And the second. And the third. In the next inning she collected two more K’s sandwiched around a popup. In the third, she mowed down the first two batters on six pitches. The third batter took her to a full count, then went down swinging.

Nine batters up, eight strikeouts and a popup. Marissa Cappello, in her own quiet but forceful way, announced to everyone watching the game that day that she was back.

I made my way behind home plate to where my wife watches the game and keeps score. I could tell she was fighting tears underneath her sunglasses. I also felt similar emotions that hit you when you see your child, after working so hard and being doubted, overcome so much to finally get back to enjoying what she does best. She was smiling on the mound, sharing special moments with teammates. It was a joy to see the game come back to her again.

Marissa struck out 11 batters in that mercy-shortened five-inning contest for a two-hit shutout. It was a statement game. Not only did Stevens get back their starter, they got back an ace.

The Marissa train was just getting out of the station. Over her first five games since being granted one more shot, she pitched four shutouts, winning all five while allowing just one earned run, recording a ridiculous ERA of 0.23, collecting bushels of strikeouts and allowing a miserly five walks.

She would go on to win 11 of the last 12 regular season games she pitched, helping her team gain second seed in the conference playoffs. The only game she lost in that span was an epic battle against eventual conference champion St. John Fisher, where Marissa battled Thayer in a 0-0 game through nine innings. With the tenth inning starting with an International Tiebreaker Rule (ITB) baserunner at second base, Fisher’s Sarah Kubik, who would go on to win the conference co-Player of the Year award, snapped a curve ball away over the left-field fence for the 2-0 victory. A disappointing finish, but Marissa matched the best for nine innings.

When Stevens visited Moravian College late in the season, I was honestly thinking maybe this is about the time for a clunker. As Marissa took the mound for the second game of that doubleheader, she was facing a potential Goliath, a team with a 25-game win streak, ranked sixth in the nation, and a balanced lineup half full of .400 hitters. This was not going to be easy.

But in keeping with the theme of her magical season, Marissa held Moravian to zero runs for seven innings. Her team didn’t score through regulation either, so the game went extra innings. With the eighth inning starting immediately with an ITB runner at second, Stevens was able to push two runs across the top of the eighth.

The bottom of the eighth was vintage Marissa. Facing Moravian’s aggressive 2-3-4 hitters, she struck out the first two, both swinging. With the cleanup hitter stepping to the plate as the tying run, Marissa took her to two strikes, then threw her special screwball to a location over the plate that has earned her countless knee-buckling called strikeouts in her career. With half the team leaning to run in on the strike three call to celebrate the victory, the home plate umpire kept his arm low and didn’t say a word. Ball. With second life, the batter took a one-arm poke at a curve ball away, depositing the ball over the first baseman for a hit, voiding the shutout and the epic ending. But Marissa regrouped and got the next girl to ground out. She had tamed a mighty beast.

But if the Moravian game proved anything, it was that Marissa was now the beast. Through all the sweat, the drills, the challenges, the doubters–this was who she had become. 

When she is on her game, Marissa brings an electricity to the mound that is fun to watch. She is all business in the circle. You won’t hear any grunts or primal screams. You won’t see any fist pumps. But make no mistake each pitch is packed with energy and grit. You’ve got this girl, who at 5’5” is on the short side for most successful fastpitch softball pitchers, coming at you with four effective hard pitches that she attacks the zone with from all different directions, in seemingly random order. Trying to barrel up on one of Marissa’s pitches can at times be like trying to split a hair with a samurai sword.

After Marissa finished the regular season with a 13 K, 3-hitter against a decent Susquehanna squad, one of her teammates slipped her the game ball as a sign of how much her performances meant to the team.

This was the moment she had worked so hard for. She can finally say with confidence that her teammates can trust in her again.


***


The Tincher Method, created by Denny Tincher, is the program Marissa adopted and leaned on this past year to help pull out her talents. Denny is very knowledgeable about the mechanics of the fastpitch motion. Special thanks goes out to him for being available throughout the process as Marissa encountered the challenges throughout her comeback trail.

Meet the new Park Factors - Part I

“It’s a park that could make you a hero or a bum.”

– Stan Musial on the Polo Grounds, 1957

stan_musial

Stan Musial was truly one of the most consistently great hitters baseball has ever seen. With a lifetime average of .331, his slumps were like comets—showing up every few years, then disappearing in a flash.

Yet, the numbers show that Stan the Man was wildly inconsistent from one year to the next. Seven times, Musial’s home and road batting averages differed by more than 70 points. Musial was at his unpredictable best between the ’52 and ’53 seasons, when his road batting average dropped 77 points at the same time his home average jumped 84 points.

musial_stats

His roller-coaster ride didn’t stop there. As if it was in his DNA, Musial’s Jekyll and Hyde act can be seen from his days at the Polo Grounds. In ’56, a 35-year-old Musial batted a pathetic .146 at the home of the New York Giants, which helped drag his overall average down to a career low .310. That same year, Musial smacked those same New York Giant pitchers all over Sportsman’s Park—his home field in St. Louis—to the tune of a .385 average while batting .348 at home overall…so it was truly the Polo Grounds that haunted him. Then the very next season, Musial went from misery to paradise at the Polo Grounds, blistering baseballs all over the park like it was batting practice, batting a lusty .439 on his way to his seventh(!) and final batting title.

polo_grounds

Polo Grounds

Musial said the Polo Grounds was “a park that could put you into a batting slump by persuading you to change your normal swing to go for the fences.”

He spoke of his love-hate relationship with the stadium’s odd, bathtub-shaped dimensions of the outfield fences (279 feet to left, 258 feet to right, and 480 feet to straightaway center) saying, “It could break your heart on those long outs to center and give you a cheap home run down the lines. I’ve had good days and seasons at the Polo Grounds and poor ones, too, though overall I’d say it was very good to me.” He was right. His lifetime average of .342 there was 11 points above his career average.

For a player who was always hitting, there’s no rationale that explains the twists and turns in Stan Musial’s career. But despite his flip-flopping at different ballparks from one year to the next, Musial was amazingly able to finish his career with exactly the same number of base hits at home as on the road, 1,815*. Somehow, the “Donora Greyhound” evened things out in the end.

It’s not far-fetched to call Musial’s career symbolic of the typical ebb and flow for a major league ballplayer. You might even say Musial is Exhibit A in the case against using Park Factors, as they are calculated today, to measure what its name seems to imply—ballpark impact.

***

The Metrodome in Minnesota, the largest pinball machine in the world, is now closed for business—as far as major league baseball is concerned.

metrodome2

The Metrodome

In its 28 seasons, the domed home of the Twins gave the game more than its share of unusual ballpark effects. The coloring of the Teflon-coated ceiling had a way of turning fly balls into Stealth mode projectiles, leaving countless fielders squinting at aerial drain pipes trying to pick up a baseball gone AWOL. Supported only by air pressure, the roof was also known to swat at a ball or two, rudely interrupting sure home runs and sending them back to the field into a waiting glove or to green empty space.

The field’s slick turf made choppers squirt between fielders like runaway super balls down a city street. And talk about a home-field advantage. The fully-enclosed facility made its 50,000+ fans sound more like 500,000. Come playoff time, the 115-decibel sonic assault on the opposition played such a dooming role for Twin opponents during their two championship seasons in ’87 and ’91, the names of each ticket-holding fan should have been listed in the credits of the World Series videos. The proof was in the box scores: both series went seven games, with the home team winning each and every time.

target_field

Target Field

As the Twins head outdoors to Target Field for the 2010 season, baseball speculators—a group that includes about 21.5 million baseball fans—have been taking their best shots in predicting whether the Twins’ new digs will be more of a pitcher’s park or a hitter’s haven. Of course the chilly Minneapolis weather seems to be getting most of the attention.

By October, we’ll have a better idea how Target Field plays. But looking back, where did the Metrodome sit in the spectrum of how it influenced the statistics? With the skewed foul line dimensions (343 feet down left, 327 to right), the fixed indoor temperatures, moderate elevation (it played to about 840 feet above sea level), and lack of wind (at least not natural), how conducive was the Metrodome to homers when compared to other major league ballparks?

Therein lies the problem. Despite 28 years of performance data to chew on and a generation of modern sabermetrics on our side, we’re still not quite sure. Baseball experts have dazzled us with enough number-crunching muscle to convince us that they could probably figure out a Park Factor for the moon. Unfortunately, when it comes to quantifying a ballpark’s influence on baseball offense, those Park Factors are as much help as a weather vane is to a meteorologist.

Statistical baseball analysis has come a long way. In previous generations, fans got by with a basic set of numbers like runs, doubles, and batting average—pretty much anything you’d find in the back of a baseball card. We collected those cards and played our Strat-O-Matic and fell in love with the sport without the need for any massaging of the stats.

Over time, the idea that raw baseball data could be misleading if it wasn’t put into its proper context gathered some serious steam. At first, it was about comparing performances from different time periods, like trying to equate Carl Yastrzemski’s measly AL-leading .301 batting average in a run-starved ’68-season to George Sisler’s .420 mark in the exploding offensive era of 1922. Then the tripping point came when saber-righteous folks realized that a player’s true value could be better understood if his numbers were adjusted according to the environment in which he produced those numbers. Today, with sabermetricians using their own home-brewed techniques for compensating, manipulating, and normalizing the figures, the baseball world is now full of interpretative player analysis and projections that give the hard-core fan, fantasy GM, and even major league execs a convincing nudge into thinking how a player’s performance should be recognized.

Park Factors were created specifically for these type of adjustments. The concept was the brainchild of legendary baseball analyst Pete Palmer, who recently joined nine other esteemed baseball researchers and historians to become the inaugural recipients of the Henry Chadwick Award, an honor that has spawned a virtual “Hall of Fame” for the SABR organization. Palmer’s amazing career includes introducing OBP as an official stat and co-authoring the impressively thorough Total Baseball encyclopedia series. He is probably most famous for uncovering a scorekeeping mistake that was made during the 1910 season when two of Ty Cobb’s hits were counted twice—a controversial finding that was made public about the same time Pete Rose was homing in on Cobb’s career hit title.

sabr_cobb

Palmer recognized that performance numbers can be squashed by hard-luck home fields, such as what Jack Murphy Stadium seemed to do to Dave Winfield in the 1970s. He also knew that certain players were able to adapt their skills to a ballpark’s nuances, like the way Fenway’s Green Monster helped turn Wade Boggs into a doubles machine. He wanted to create a “statistical balancer,” with the intent to separate the ballpark influence from a player’s performance numbers, leaving only his true ability. Using OBP+SLG as a production yardstick, Palmer created PRO+, which adjusted a player’s production to the ballpark and league averages. (Later, OBP+SLG became more commonly known as OPS, and PRO+ became OPS+.)

Park Factors not only gave Palmer a way to adjust a player’s park-influenced numbers to league norms, they hinted at a ballpark’s impact on offense. Expressed as a simple integer (no decimal points!), any Park Factor value above 100 steers toward a hitter’s park, and any value below 100 becomes more friendly to pitchers, with 100 representing a perfectly neutral park.

Not only were Park Factors easy to figure out (they had to be—Palmer needed to apply them to seasons dating back to 1871), they could isolate on one statistic. For instance, a Park Factor based just on home runs—a.k.a. the “Home Run Park Factor” (HRPF)—would be useful for gauging a ballpark’s allowance for the long ball. These Park Factor components show how certain home fields have selective influences. A recent mlb.com article talked about how Citizens Bank Park in Philadelphia can be “homer happy” while at the same time make doubles and triples harder to come by.

Of course, when it comes to the ballpark effect, no playing field has ever had more of an impact on jacking up offense than Coors Field. During its pre-humidor hey days of the 1990s, the home of the Rockies became the greatest environmental influence on the long ball in the history of the game (that is, aside from anything that might fit into a syringe). Despite having the longest fences in the majors to counter Denver’s thin air, the Coors impact showed up in its outrageous HRPFs that soared well past 150 for some of those “enhanced” seasons.

But we’ve got some issues with these Park Factors. The calculation itself should clue us in on why these often-quoted numbers waver more than Brett Favre. Focusing on home runs, here’s the basic form of a HRPF calculation:

basic park factor

ESPN.com has been publishing Park Factors using this same formula since the early 2000s. In essence, the Park Factor compares all statistical performances at a particular ballpark to the performances of the home team’s road games, with the premise that a park’s influence will become exposed by the differences.

Palmer made a few compensations on top of this calculation to tweak for some inaccuracies, such as the fact that a victorious home team never plays a full bottom half of the last inning, making the “per game” numbers inconsistent. I won’t expand on these compensations here. The important point I want to bring out is that the Park Factor is geared totally on the performance out on the field, not on any particular characteristic of the ballpark itself. There is no atmospheric element to reflect the higher altitudes, no compensation for a huge foul territory, and no acknowledgement of a short right-field porch. It’s all performance.

It’s also called inference, because the ballpark’s vulnerability to offense is inferred through the those same offensive numbers.

The inference works for Palmer, who wasn’t particularly interested in how charitable a ballpark was to offense; he was searching for true performance value within a specific context. But if you want to judge a ballpark’s effects numerically by quoting Park Factors, you have to realize that these numbers are bleeding with biases involving the schedule, team makeup, matchups, the fickleness of weather, as well as with players who get injured, go on hot streaks, and are burdened with personal issues.

So was the Metrodome a hitter’s park or a pitcher’s park? Well, it depends on who you ask, and which season you are talking about. When the Twins started playing there in 1982, they didn’t tag it as the “homerdome” because of fan patriotism—HRPFs peaked as high as 129 in 1986. Then the home runs faded, and the park more or less lost the nickname.

In 2007, the Metrodome HRPF measured just 75, the lowest in the American League. Two years later it jumped to 111, good enough for 8th place out of 30 major league teams. Remember, we’re talking about a domed stadium with a controlled atmospheric environment. What could have changed between those two seasons? Did they bring the fences in? Did they start pumping lighter air through the ventilation system? None of this happened. Only the performances on the field changed.

Take a closer look. The chart below breaks down the HRPF calculation for the Metrodome from 2007 through 2009.

metrodome_HRPF_2007_2009_only

What stands out is how Twins hitters doubled their home runs from ’07 to ’09, going from a 48/70 (home/road) differential in 2007 to 96/76 two years later. From just this home team hitters perspective, which accounts for half of the HRPF calculation, the Metrodome went from an extreme pitcher’s park to an extreme hitter’s park in just two seasons.

Sure, this is a poor sampling of statistics to make any reasonable conclusions. Call 2009 a spike season for the Metrodome if you’d like. But then, what’s the point of even calling it a “Park Factor”? We know it wasn’t the Metrodome that went schizophrenic.

The longer-term HRPFs are just as puzzling. Over the past seven seasons the Metrodome’s average HRPF of 90, certainly a “pitcher’s park” number, conflicts with its first seven seasons—those “homerdome” days—when it recorded an average HRPF of 106. This difference highlights an important characteristic of Park Factors that’s both good and bad: The calculation relies as much on performances at its own park as the performances and tendencies of other ballparks. Translation: The Metrodome numbers tells us that the other AL ballparks had “caught up” to the Metrodome’s home run tendencies, causing the Metrodome’s HRPF to drop.

This “relative” nature of Park Factors works well for what Palmer was trying to do. By making adjustments according to a player’s environment—which includes his team’s makeup and his home ballpark—the relative value of the run within that environment can be determined. Knowing how to measure whether runs were cheap or hard to come by is the basic formula for determining a player’s true value. Quantifying a player’s contribution to creating runs and wins for his team is the motivation behind such sabermetric staples as “Runs Created” and “Win Shares,” two of Bill James’ creations. (Like Palmer, James was one of ten who received the Henry Chadwick award this past month).

But this methodology doesn’t work for someone trying to truly isolate the ballpark effect. Think about it this way. In an imaginary world, we can build a league with all hitter’s parks—bring all the fences in, build every site at 1,000 feet above sea level, and play only when the wind is blowing out. But by the end of that imaginary season, our Park Factor calculations are still going to cough up at least a handful of “pitcher’s parks” because of the collection of different teams, offenses, and pitching staffs, not to mention the funky player biorhythms; doesn’t matter that we built the league entirely with hitter’s parks. The Park Factor is a relative measurement.

For me, the final nail in the coffin for using Park Factors to gauge ballpark effects came with the 2009 HRPFs of Citi Field in New York and Citizens Bank Park in Philadelphia. Citi Field’s score of 106 beat the Bank by five points, which came in at 101. Are we really supposed to believe that hitting a home run at the canyon-esque home site of the Mets which single-handedly turned David Wright into a singles hitter is five percent easier than knocking one out at the generous, sometimes wind-friendly, flower-beds-in-your-face park of the Phillies? Really?

Of course not. Anyone who followed baseball games at those sites last year would have expected Citi Field’s HRPF to fall somewhere below 100—at least below that of Citizens Bank Park. The only way I could believe someone’s claim that Citi Field was easier to hit home runs than Citizens Bank Park is if we were able to take an inventory of every fly ball that had a chance to leave those ballparks and figure out which homers at Citi Field would not have been homers at Citizens Bank Park (and vice versa), and which fly balls that stayed in the park at Citi Field would have been homers at Citizens Bank Park (and vice versa). Only then could we even begin to quantify with a decent level of accuracy how much easier or harder it would be to hit a home run in one park versus another.

Great news. This type of information is available to us. It’s not yet in the form of how I just described here, but we’re getting really close.

A better way to compare the relative difficulty of hitting home runs at different ballparks comes courtesy of Hit Tracker, an analytical mechanism created by Greg Rybarczyk which is featured on his site hittrackeronline.com. It’s one of the most revolutionary sabermetric tools today, with a cool factor that’s through the roof.

Hit Tracker mixes the principles of physics with observation clues to analyze as many relevant characteristics of a major league fly ball as one could possibly track and draw conclusions about its trajectory. Let me skip the technical details for now and demonstrate how this analysis gives the park-by-park comparisons we’ve been looking for.

For every home run hit in a given ballpark, Hit Tracker attaches a ranking that ranges from 0 to 30. The number represents how many major league parks that particular trajectory would have been a home run in if it was hit under “average weather conditions.”

An example. On May 7th of last season, David Wright smacked a 1-2 pitch from the Phils’ Jamie Moyer that traveled 434 feet toward just left of dead center at Citi Field, easily clearing the deepest part of the park. If we mapped the trajectory of that Wright home run using the same speed of the ball off the bat (105.2 mph), the same vertical launch angle (26.9 degrees) of the ball off the bat, and the same direction of the ball’s path out on the field, it would have been a homer in every major league park. Hit Tracker tells us this by assigning its maximum ranking of 30 to that Wright home run.

DWright_HR_05072009

David Wright HR on MLB.com and Hit Tracker

On the flip side, Chase Utley took advantage of a 50-mph wind on April 18th of the same season when he launched a towering fly to right that traveled 351 feet, good enough to clear the 330-foot fence in right at Citizens Bank Park. Under normal conditions—average wind, etc.—the trajectory on Utley’s home run would have traveled just 302 feet, and, considering the direction he hit it, would have failed to clear the fence anywhere in the majors, including Citizens Bank Park, earning it a ranking of 0.

CUtley_HR_04182009

Chase Utley HR on MLB.com and Hit Tracker

Let’s see how this helps us. I created a “HR Legit” rating system for judging a home run according to its Hit Tracker ranking:

legit_tags_hittracker_numparks_ranges

We’re essentially judging how much of a player’s home run was earned. On one end of the scale you’ve got the “no doubt about it” jobs that were tanked; they would have been four-baggers just about anywhere. On the other end lies the “pure luck” homers that practically needed a special alignment of the stars to get the batter a free jog around the bases. I considered any home run with a ranking of greater than 15 as “still legit” because it would have been a home run in more than half the ML parks. Home runs start to become “cheap” with rankings under 15.

Next, I graded each home run hit at Citi Field and Citizens Bank Park during the 2009 season according to these “HR Legit” ratings and came up with the following distributions for those two parks:

citi_vs_cbp_2009

Suddenly, the 2009 HR Park Factors for Citi Field and Citizens Bank Park seem about as genuine as Milli Vanilli. Our rating system shows that 97% of home runs hit at Citi Field were legitimate shots, much higher than the Bank’s 75%. Only two home runs at Citi Field were considered “pure luck” or “cheap” in 2009, while there were 28 such home runs hit at the Bank. This data suggests that out of the 77 more homers hit at the Bank (207) than at Citi (130), a good chunk came courtesy of the philanthropic ballpark conditions in Philly.

Our little investigation here doesn’t include those fly balls that weren’t home runs in these parks but would have been home runs in other parks. So we’re not going as far as we can here. But this is enough to convince this baseball fan that there’s a better way to track the impact of a team’s home field to baseball performance than the traditional Park Factor system now in place.

The issue of building a “better” Park Factor has been tossed around by several accomplished baseball researchers in recent years. In part II of this post, I’ll talk about some of the tools and analysis being used at baseball games today that will help clean out the irrelevant data noise from Park Factors. The technology for finding a true measure of ballpark impact has arrived.

***

*Thanks to Lee Allen and Bill Deane for discovering and confirming this fun baseball fact. Allen, who died in 1969, was one of the ten inaugural recipients of the Henry Chadwick award. Deane, who helped me dig up the splits on Stan Musial, will surely follow in these footsteps someday.

**To Pete Palmer: Thank you for helping me stay in-line with actual history.